Spåtalytics | Spåt 2025
Introduction
A metric that automatically calculates athlete's physical load from a training session, using only position data from UWB sensors. It provides injury prevention from overtraining and allows more optimized improvements for all level athletes. Versatile and accessible solution that can be utilized with almost every sport. Works with Spåt App.
Goal
An accurate physical load metric that can be used to optimize coaching. This metric would be calculated using only locational data from UWB sensors, and subjective data from the athletes via Coachtools.
Implementation
The metric was developed independently and later on it was integrated to the API. There were not any open endpoints for data fetching from Spåt or CoachTools, so we decided to develop a software robot to automate the data handling from the applications to our own interface/database.
Original plan was to use objective data from the UWB sensors from Spåt and subjective data from Coachtools, but later on this subjective data failed, and we did not get sufficient amount of it. The software robot was developed in mind of working with multiple sources, but current implementation works only with Spåt.
The development of the metric included the usage of these technologies and libraries:
- Python
- Jupyter Notebook
- Pandas
- NumPy
- Scikit-learn (sklearn).
The development of the interface and database solution included the usage of these technologies and libraries:
- Python
- MongoDB
- FastAPI,
- PyMongo
- Openpyxl
The development of the software robot included these technologies and libaries:
- Python
- Selenium
- GitHub Actions
Results
We resulted in academically backed (S. Urrutia, Á. Cappuccio, and A. González-Ramírez, “Equation for player load control of training with GPS in a high-performance soccer”, Retos, vol. 58, pp. 913–918, Sep. 2024, doi: 10.47197/retos.v58.106632.) physical load metric that calculates volume (=total effort) and intensity (=effort per minute) from only positional data. It combines these and uses history values and team averages to provide 0-10 value of the physical stress of the session for each player.
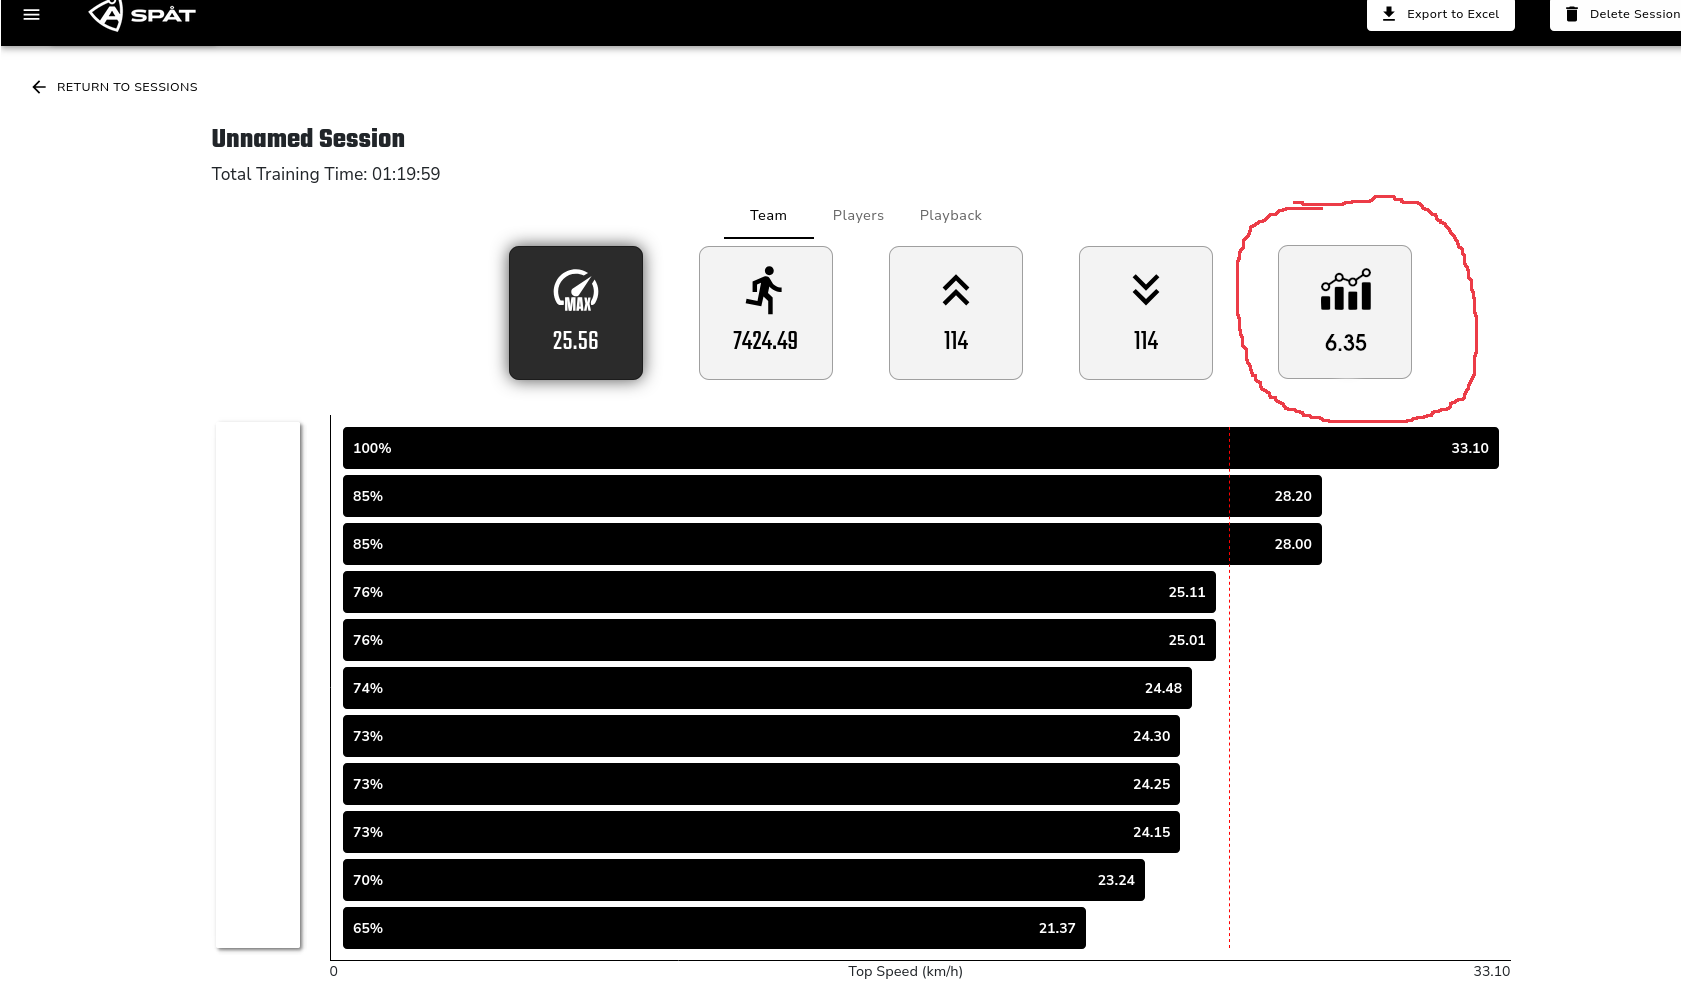
The interface stays probably only as a prototype and a demonstration, Spåt will probably do their own implementation of the integration to their app. The image underneath this text is a visualization how the metric is planned to be implemented to the existing Spåt App.
Promo Video
https://www.youtube.com/watch?v=Kpl8eHX6pQk