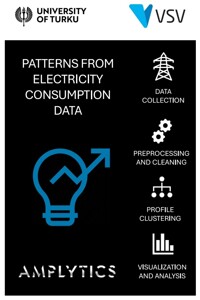
Amplytics 2025
Introduction
Our mission is to create electricity consumption profiles from a year long time series electricity data for VSV , a local energy provider company. This was done by clustering the data using different data analysis techniques. Electricity consumption profiling aims to help energy providers better balance out their energy production and to have better understanding of their customer base and their consumption habits.
Goal
Having a deeper understanding of energy consumption, by utilizing clustering methods to gain insights into energy consumption behavior and usage patterns. Considering the complexity of energy consumption data, clustering helps us pinpoint the most impactful insights, so that we can turn raw data into strategic value.
Implementation & Results
We utilized different data analysis methdos such as K-means clustering, K-means over generated features, two-step clustering method with K-means and hierarchial clustering, and DTW-SOM
K-means clustering
K-means clustering was used to categorize data into clusters based on Euclidean distance. The algorithm initializes k clusters randomly and assigns each data point to the nearest cluster, iteratively updating cluster centers to form coherent clusters.
K-means over generated features
Data summarized into weekly rows with 38 generated features (e.g., average, nighttime, standard deviation, rolling week consumption). Data split by fuse size (small, medium, large). Features standardized and reduced using PCA for visualization. Optimal k-value determined using the "elbow" method.
Six distinctive customer groups identified, including: Small households with minimal energy return, Larger households with high consumption, Industrial sites with extreme consumption and reactive power, Facilities exporting energy with power factor correction
Two-step clustering methods with K-means and hierarchial clustering
Initial clustering based on daily total energy consumption using K-means. Hierarchical clustering applied within the first-step clusters to refine consumption pattern insights. Resulted in 18 clusters capturing both energy levels and consumption behaviors.
DTW-SOM
DTW used instead of Euclidean distance to compare signal similarity. SOM applied to cluster raw time-series data. Produced meaningful profiles but was computationally expensive. Further optimization (e.g., parallelization, LB-Keogh bounds) needed for scalability.

